Task Dashboard
The Task Dashboard provides a comprehensive overview of your task productivity, team workload, and progress metrics.
Overview
The Task Dashboard displays key statistics, charts, and analytics to help you understand your task management performance and team productivity at a glance.
Page Layout
Header Section
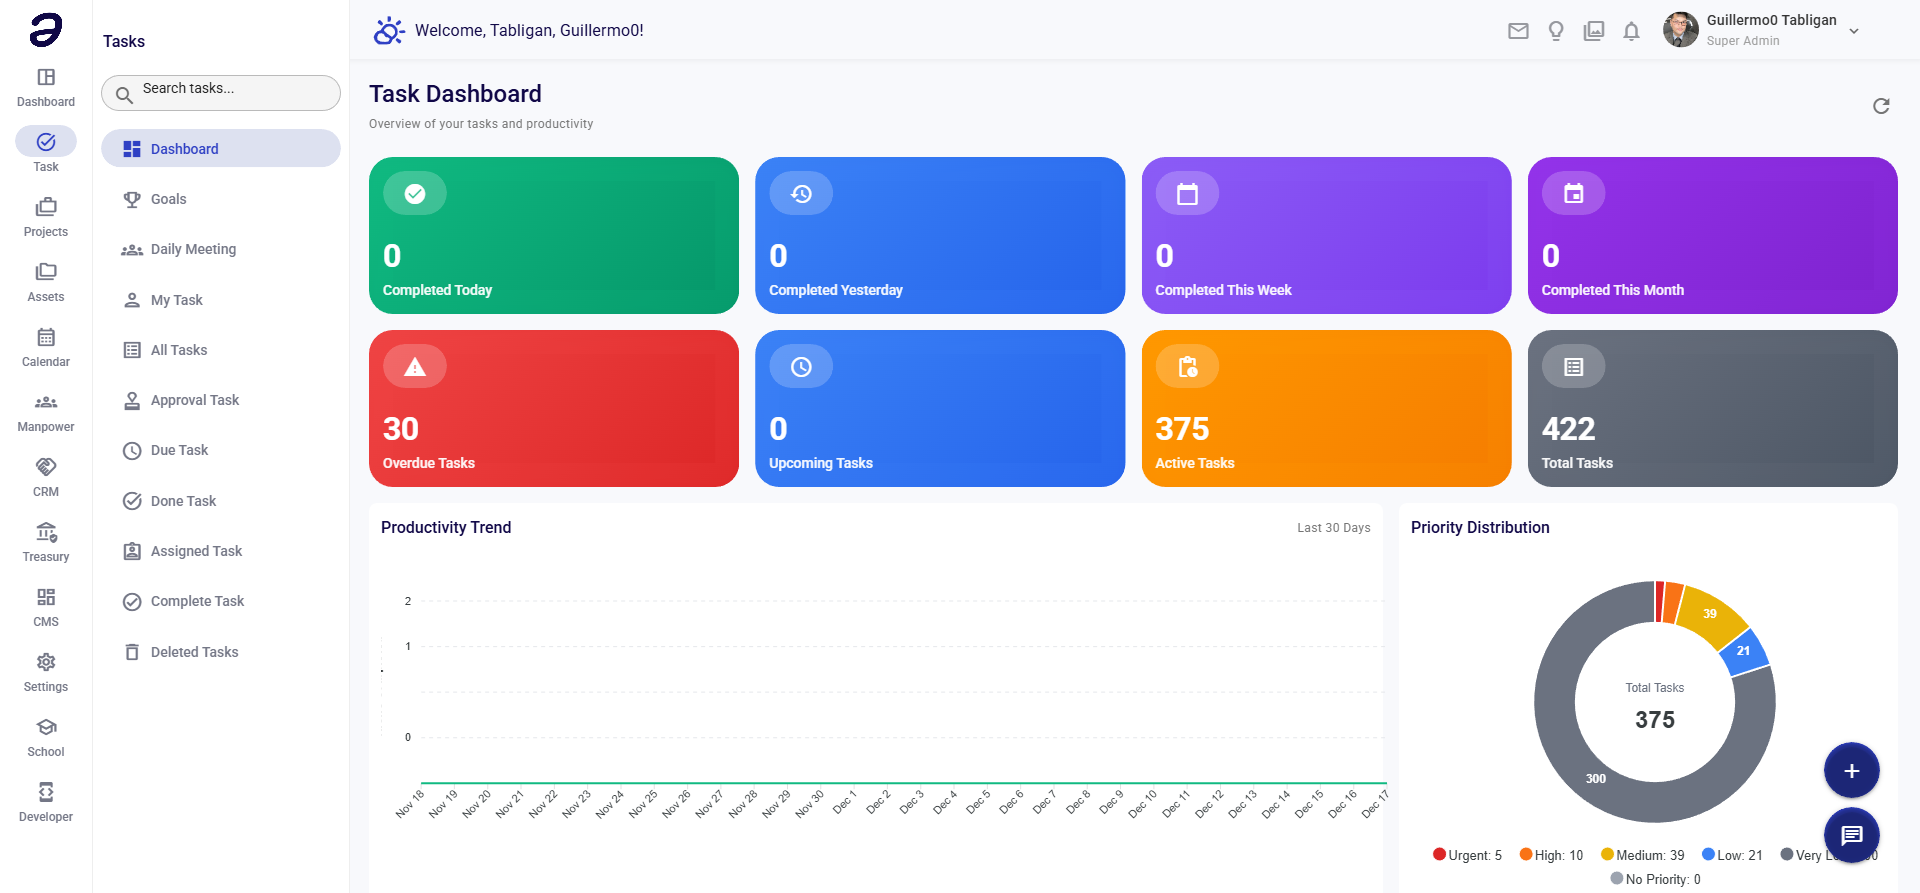
- Title: "Task Dashboard"
- Subtitle: "Overview of your tasks and productivity"
- Refresh Button - Reload dashboard data
Statistics Cards
Completion Statistics (Top Row)
- Completed Today - Number of tasks completed today
- Completed Yesterday - Number of tasks completed yesterday
- Completed This Week - Total tasks completed this week
- Completed This Month - Total tasks completed this month
Task Status Cards (Second Row)
- Overdue Tasks - Clickable card showing number of overdue tasks
- Upcoming Tasks - Tasks due soon
- Active Tasks - Currently active tasks
- Total Tasks - Total number of tasks in the system
Charts and Analytics
Productivity Trend
- Title: "Productivity Trend"
- Period: "Last 30 Days"
- Shows a line chart of tasks completed over the last 30 days
- X-axis: Dates (Nov 18 - Dec 17)
- Y-axis: Number of tasks completed
- Helps track productivity patterns over time
Priority Distribution
- Title: "Priority Distribution"
- Pie chart showing task distribution by priority:
- Urgent - Highest priority tasks
- High - High priority tasks
- Medium - Medium priority tasks
- Low - Low priority tasks
- Very Low - Very low priority tasks
- No Priority - Tasks without priority set
- Click on any priority to filter tasks
- Shows total task count
Team Workload
- Title: "Team Workload"
- Subtitle: "Top 10 Assignees"
- Bar chart showing task distribution across team members
- X-axis: Number of tasks
- Y-axis: Team member names
- Helps identify workload balance across the team
Status Distribution
- Title: "Status Distribution"
- Pie chart showing task distribution by status:
- BackLog - Tasks in backlog
- Done - Completed tasks
- In Progress - Tasks currently being worked on
- Click on any status to filter tasks
- Shows total task count
Goal Progress Section
- Title: "Goal Progress"
- View All Button - Navigate to Goals page
- Shows active goals and their progress
- Create Goal Button - Quick access to create new goal
- Displays "No active goals" if none exist
Actions Available
Navigation
- Click on any statistic card to view filtered task list
- Click on chart segments to filter by priority or status
- Use View All button to see all goals
- Use Create Goal button to create a new goal
- Use Refresh button to reload dashboard data
Quick Actions
- Access task creation via floating action button
- Navigate to different task views via submenu
Common Tasks
Viewing Overdue Tasks
- Click on the Overdue Tasks card
- You'll be taken to a filtered view of overdue tasks
- Review and update task statuses as needed
Analyzing Team Workload
- Look at the Team Workload chart
- Identify team members with high task counts
- Consider redistributing tasks if needed
Tracking Productivity
- Review the Productivity Trend chart
- Identify patterns in task completion
- Use insights to improve productivity
Creating a Goal
- Scroll to the Goal Progress section
- Click Create Goal button
- Fill in goal details and save
Tips and Best Practices
- Regular Review - Check the dashboard daily to stay informed
- Address Overdue - Prioritize resolving overdue tasks
- Balance Workload - Use team workload chart to ensure fair distribution
- Track Trends - Monitor productivity trends to identify improvements
- Set Goals - Use goals to track progress toward objectives
Related Pages
- My Task - View your personal tasks
- All Tasks - View all tasks
- Goals - Manage goals
- Due Task - View tasks with deadlines
💡 Note: Dashboard data refreshes automatically, but you can manually refresh using the refresh button in the header.